Every trade here had to be filed
A fund reports its portfolio once a quarter. Within 45 days of a trade, a member of the House has to file it. For an officer of a company the window is two working days. All three land here with the link to the paper, and twelve strategies run on what they say.
Money on the account is simulated. Newest filing read 14 August 2026.
- sell Ullal Jayshree ANET for $427.4K 2d ago
- sell Ullal Jayshree ANET for $9.3M 2d ago
- sell Appaloosa QCOM at 0.6% of the book 2d ago
- buy Appaloosa AVGO at 0.7% of the book 2d ago
- buy ARK Investment Management SNOW at 0.5% of the book 2d ago
- buy ARK Investment Management LLY at 0.6% of the book 2d ago
- buy Third Point SPY at 0.6% of the book 2d ago
- buy Third Point ASML at 1.3% of the book 2d ago
- buy Lone Pine Capital SE at 0.3% of the book 2d ago
Three papers, one feed
Behind every line in the mirror sits a document with an address. Open it, and the filing the line was built from is right there. So far that comes to 285 quarterly reports, 866 House filings and 465,335 daily closes across 155 instruments.
What the managers hold
Past a hundred million dollars of US shares, a manager has to file the whole portfolio 45 days after the quarter closes. Since 2021 every one of those filings is stored here, so a position can be followed back to the quarter it opened.
Tracking Berkshire Hathaway, Renaissance Technologies, Bridgewater Associates, ARK Investment Management and 9 more.
What members of the House traded
Between 30 and 45 days is what the STOCK Act allows. What the Clerk publishes is a PDF, and the table inside it gets read line by line: ticker, side, trade date, reported bracket.
Behind a browser agreement that refuses an automated request sits the Senate half of the same data, so the mirror covers the House.
What the officers bought
Two working days is the whole window for a director, an officer, or anyone holding more than a tenth of the company. Option exercises and shares withheld for tax get dropped, since neither says anything about conviction. What stays is buying and selling on the open market.
The mirror
Sorted by the day the filing became public, which is the first day anyone outside could act on it.
| Who | Ticker | Side | Size | Traded | Filed | Source |
|---|---|---|---|---|---|---|
| Loading the latest filings. | ||||||
| Who | Ticker | Side | Size | Traded | Filed | Source |
|---|---|---|---|---|---|---|
| Loading the latest filings. | ||||||
| Who | Ticker | Side | Size | Traded | Filed | Source |
|---|---|---|---|---|---|---|
| Loading the latest filings. | ||||||
Twelve strategies, one measuring stick
Same window, same prices, and the same one percent charged on every fill.
Institutional Consensus
The shares the most managers bought last quarter.
Fund Mirror
One manager's portfolio, in the weights they reported.
Capitol Flow
Shares members of the House reported buying.
Insider Cluster
Companies three or more of their own officers bought inside a month.
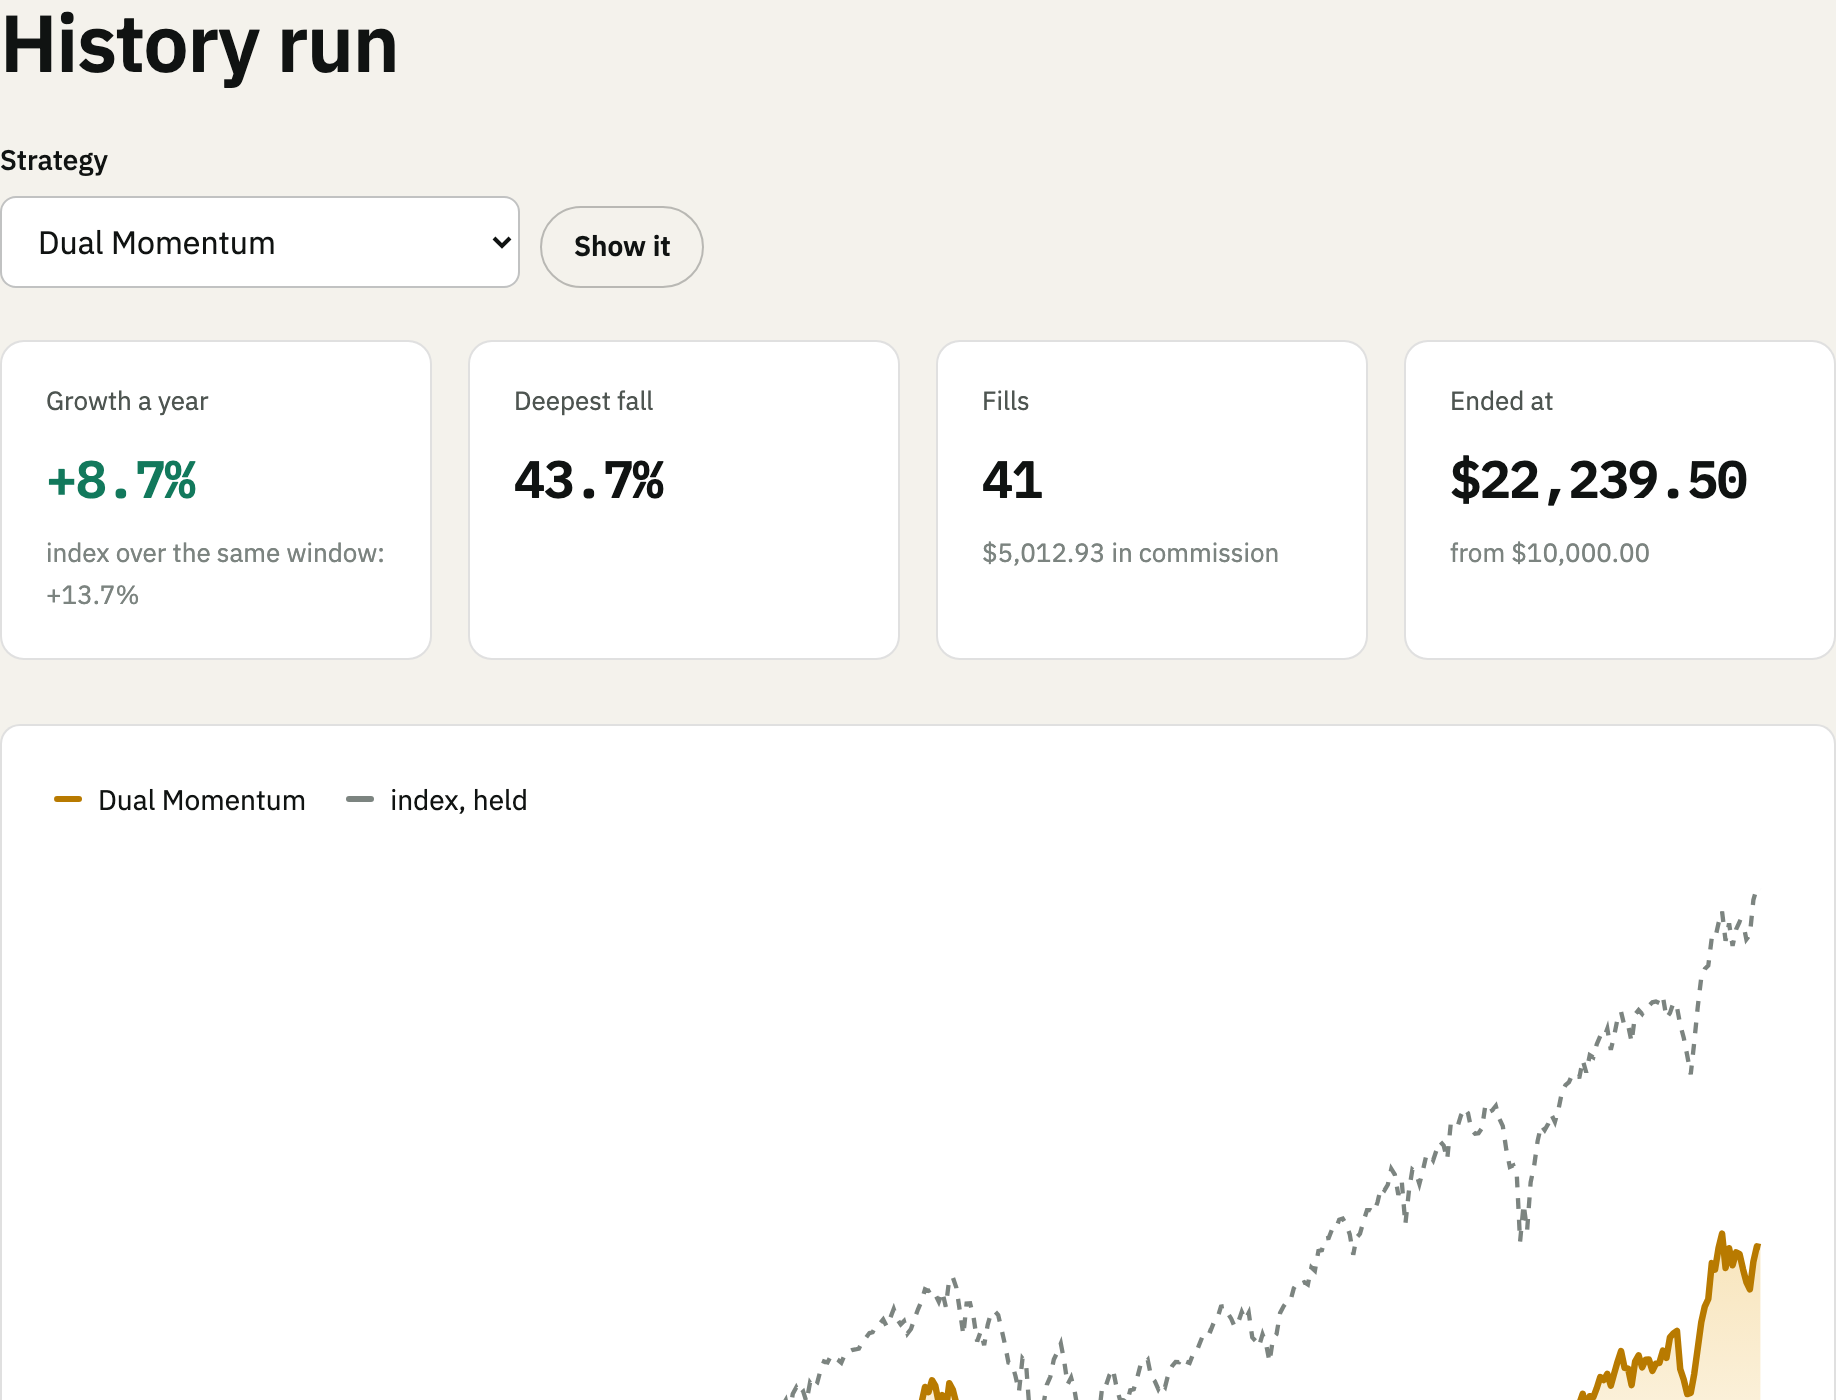
Dual Momentum
The strongest index of the last year, or bonds.
Trend 200
In while the price is above its long average, out while it is below.
Sector Rotation
The three strongest sectors of the last six months.
Risk Parity
The quiet asset gets the larger share.
Crypto Trend
Bitcoin and ether while the fast average leads the slow one.
Volatility Target
Hold less of the index while the index is moving a lot.
Ladder 36
The saving plan: a hundred dollars, a monthly payment, a target in three years.
Ladder 36 Plus
The same target, a momentum core and a small coin sleeve.
Risk Parity, up close
Shares, long bonds, gold, bitcoin and a currency pair sit in one book, and each one is weighted by the inverse of how much it has moved over the last ninety days. The loud asset gets a small slice, the quiet asset a large one, and no single leg decides the month.
03 January 2017 to 16 August 2026, from $10,000.00, Yahoo Finance daily closes.
Read the whole run- Growth a year, after the fee
- +7.4%
- Deepest fall from a peak
- 23.7%
- Paid in commission over the run
- $846.03
- Fills
- 175
A hundred dollars into ten thousand
Thirty-six months is the whole plan. Most of the target comes from the starting hundred and the monthly payment, and the portfolio adds the remainder. Move the return, and the split moves with it.
- A month, for 36 months
- $237.71
- Your own money in the target
- $8,658
- Added by the portfolio
- $1,342
| Return a year | Monthly | You put in | Earned |
|---|---|---|---|
| 0% | $275.00 | $10,000.00 | $0.00 |
| 4% | $259.24 | $9,432.64 | $567.36 |
| 6% | $251.79 | $9,164.44 | $835.56 |
| 8% | $244.62 | $8,906.32 | $1,093.68 |
| 10% | $237.71 | $8,657.56 | $1,342.44 |
| 12% | $231.05 | $8,417.80 | $1,582.20 |
| 15% | $221.49 | $8,073.64 | $1,926.36 |
| 20% | $206.67 | $7,540.12 | $2,459.88 |
Ten thousand dollars paying five percent a year is $500 a year. Left to compound, the balance is $11,576 three years later.
Inside the account
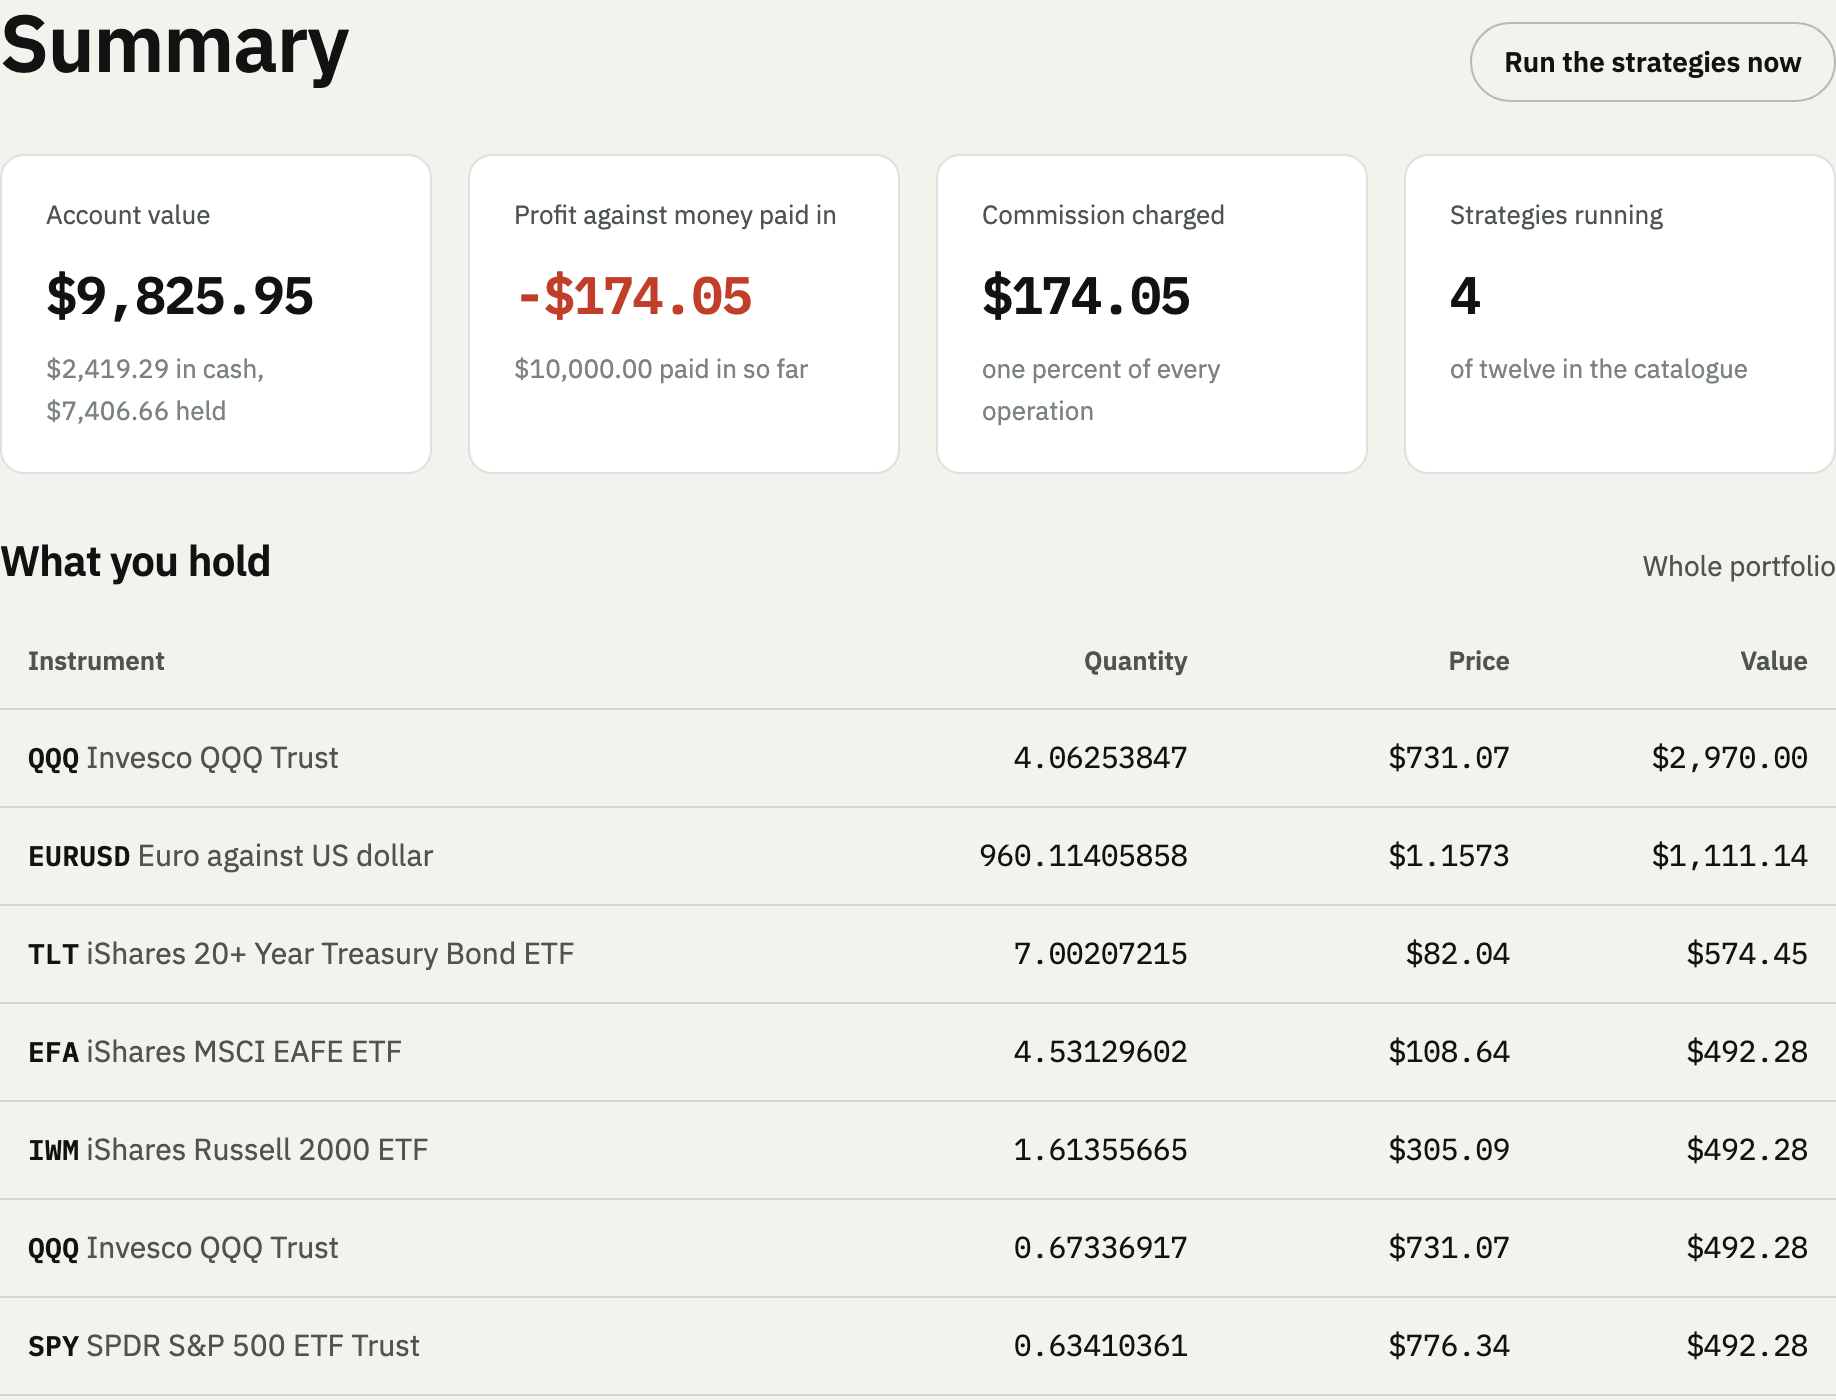
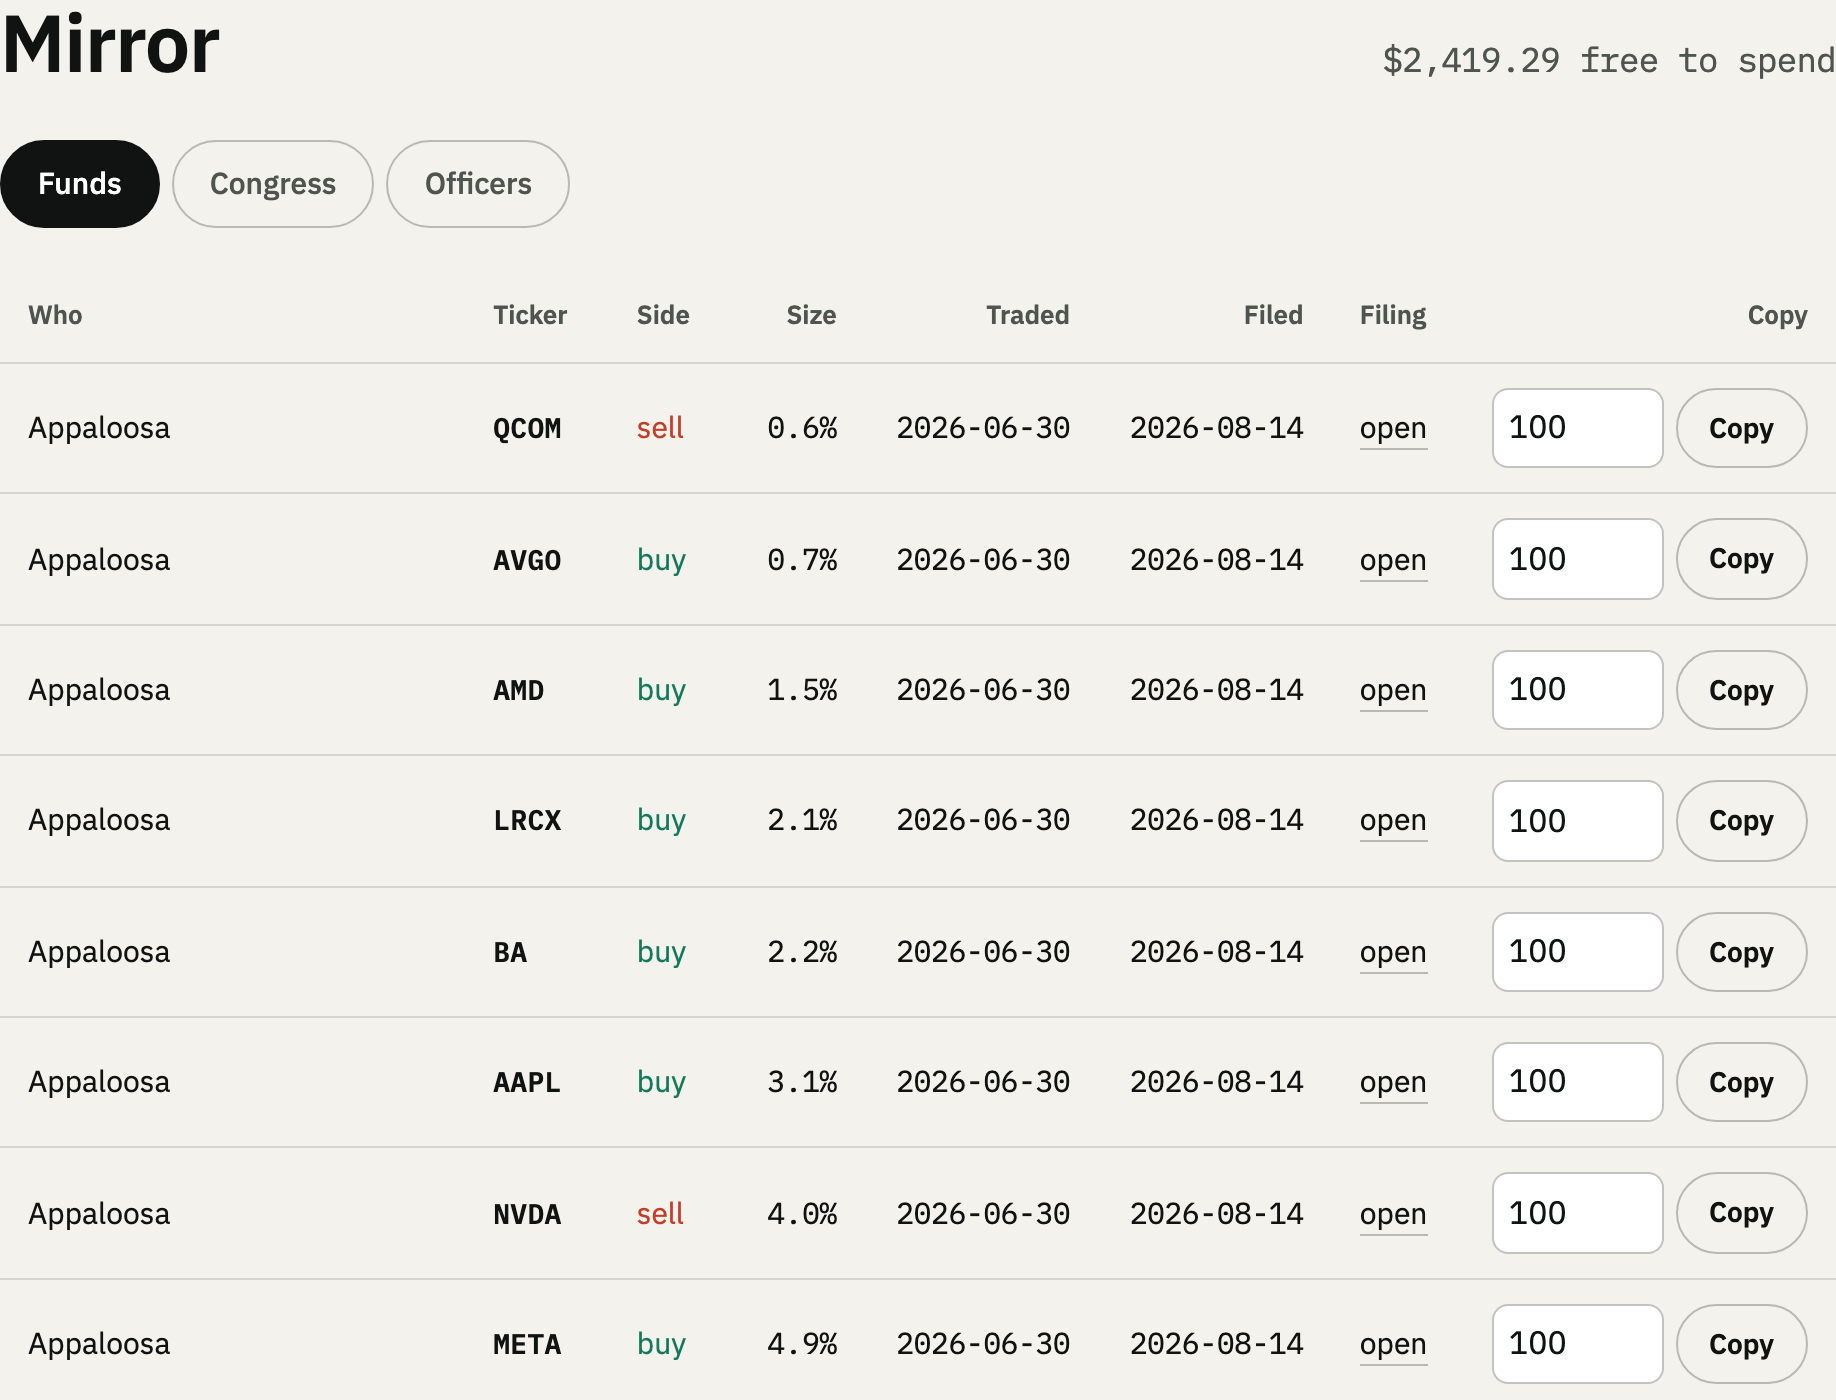
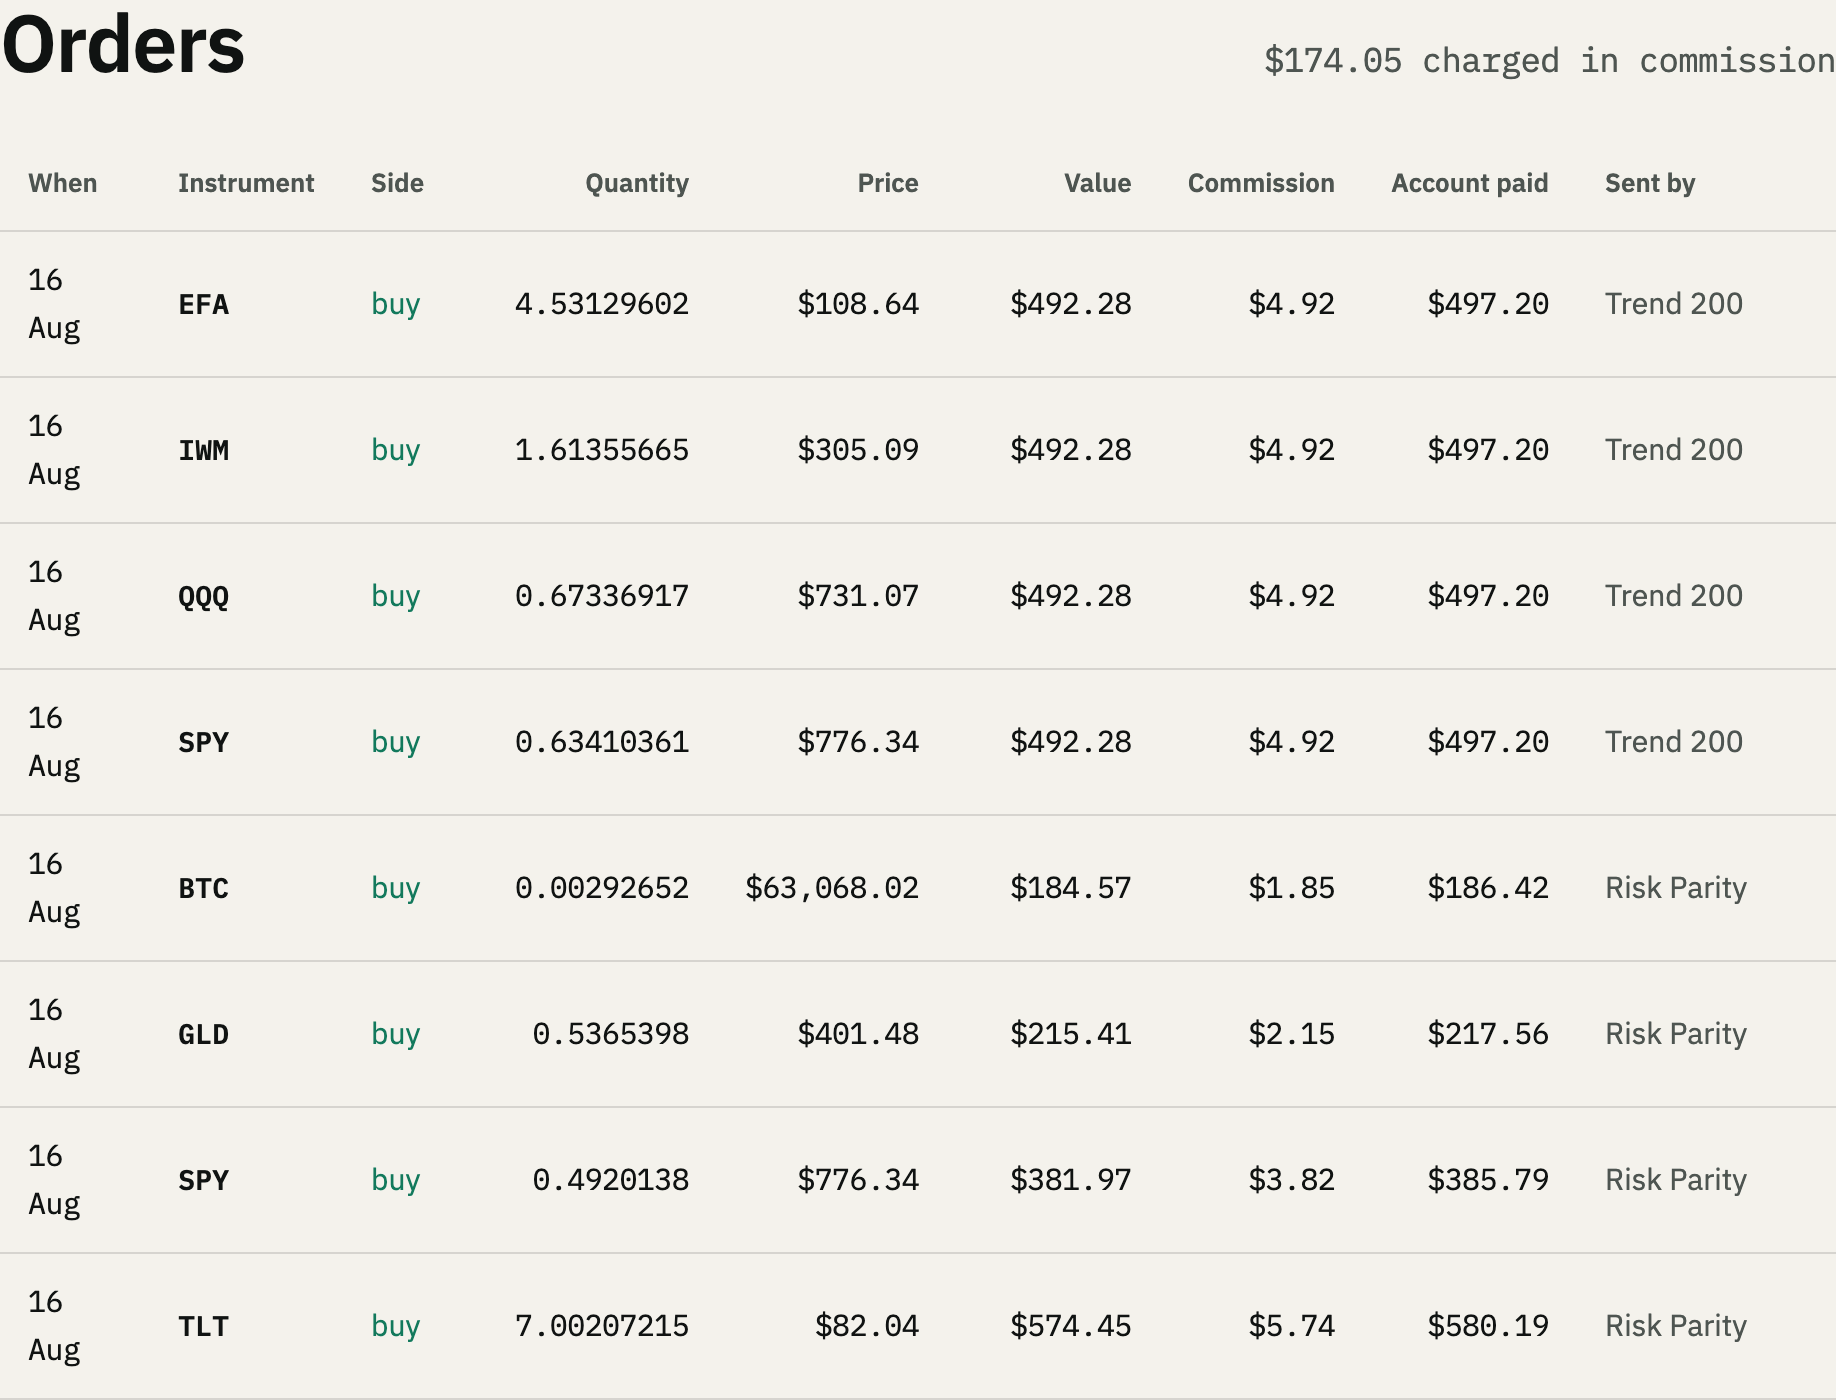
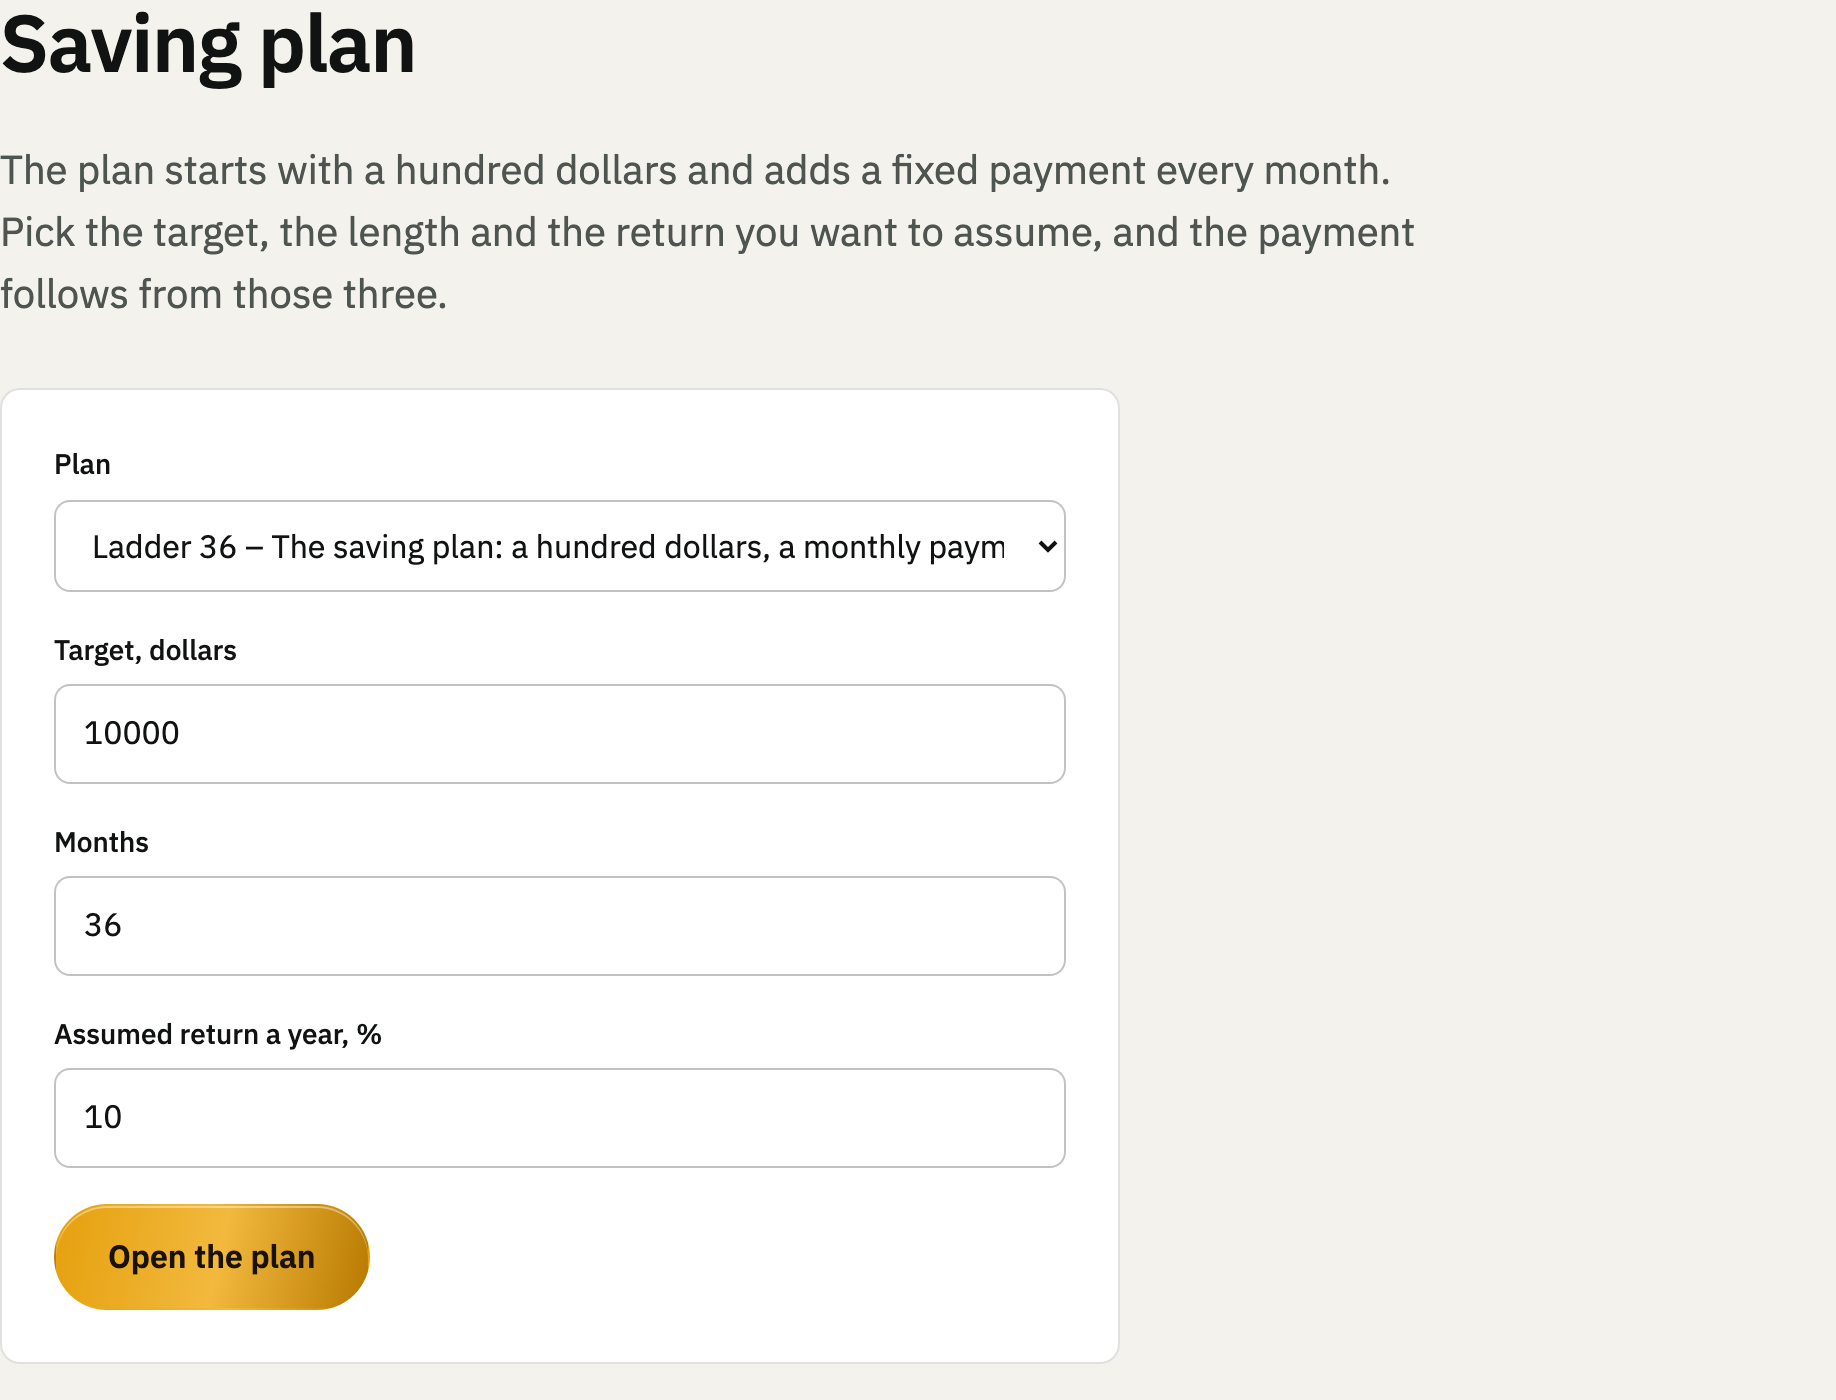
The same filings and the same prices, on the screens the money is run from.
What it costs
Watching
- The whole mirror, every filing with its source, without signing in
- All twelve strategies with their runs
- The saving plan calculator
Running an account
of every operation on the account.
- Deposits, withdrawals, buys, sells and plan payments
- Charged at the moment of the operation, shown on its own ledger line
- Nothing monthly, nothing on a balance that sits still
Questions
Is this real money?
How far behind are the filings?
Where do the numbers on the strategy cards come from?
Can I copy one trade instead of running a strategy?
What happens to the commission?
Which markets does it cover?
Read the filings, then decide
The mirror is open without an account. The strategies run on simulated money, and every fill carries the one percent.